분산 추적과 성능 모니터링 구축
분산 추적과 성능 모니터링 구축
이번 글은 분산 추적과 성능의 모니터링을 구축하면서 버전 이슈와 해결했던 경험을 적어보려고 한다.
MSA는 여러 개로 분리된 작고 독립적인 서비스들이 서로 간 통신하도록 연결된 구조를 말한다. 분리된 덕분에 서비스 간의 복잡도와 의존성이 높고 하나의 요청이 여러 서비스를 통하기 때문에 장애가 발생할 확률도 높아진다.
그러므로 요청 정보를 추적하거나 확인하는 모니터링을 구성하는 것은 필수라고 볼 수 있다.
Spec
- Spring boot 3.0.5
- Prometheus 2.37.7
- Zipkin 2.24
- Grafana 9.5.1
Zipkin 설정
Zipkin은 분산 추적 시스템으로 각 서비스를 추적하여 들어오는 요청의 소비되는 시간의 비율이나 작업 실패 여부와 같은 정보를 추적하여 조회할 수 있게 해준다.
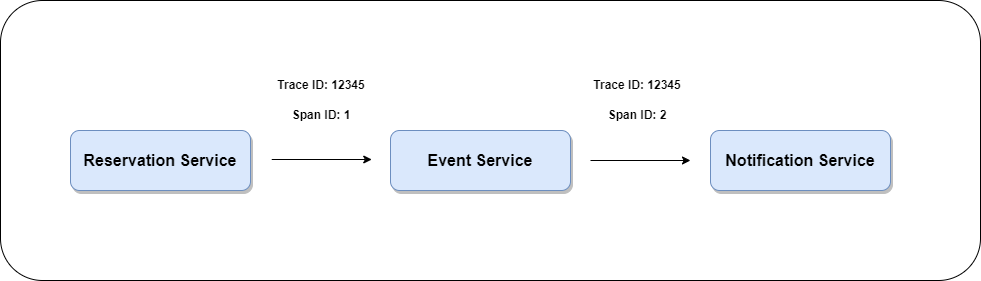
이러한 정보를 추적하려면 Trace ID 와 Span ID 가 필요하다.
Span ID 는 기본 작업 단위를 나타낸다. 그리고 Trace id 는 이 Span ID를 여러 개 포함하는 트리 구조로 되어있다. 즉 하나의 요청에는 모두 동일한 Trace ID를 가지고 있으며 서비스에 요청할 때마다 Span ID는 새로 할당된다.
zipkin을 사용하기 위해 Spring Cloud Slueth 를 사용하려고 했는데. 아래와 같은 에러가 발생했다.
1
2
3
4
5
6
7
8
9
10
11
12
13
14
15
16
17
18
19
20
Error starting ApplicationContext. To display the condition evaluation report re-run your application with 'debug' enabled.
2023-05-02T00:50:17.777+09:00 ERROR [member-service,,] 18052 --- [           main] o.s.b.d.LoggingFailureAnalysisReporter   :

***************************
APPLICATION FAILED TO START
***************************

Description:

Your project setup is incompatible with our requirements due to following reasons:

- Spring Cloud Sleuth is not compatible with this Spring Cloud release train

Action:

Consider applying the following actions:

- Migrate from Spring Cloud Sleuth to Micrometer Tracing .
You can check the Sleuth 3.1 Migration Guide over here [https://github.com/micrometer-metrics/tracing/wiki/Spring-Cloud-Sleuth-3.1-Migration-Guide].
If you want to disable this check, just set the property [spring.cloud.compatibility-verifier.enabled=false]
Spring Cloud Sleuth 에서 Micrometer Tracing으로 마이그레이션 됐다는 내용이다. (마이그레이션 가이드)
Sleuth를 그대로 사용하려면 spring.cloud.compatibility-verifier.enabled=false 옵션을 주면 된다.
Spring Cloud 2022.0 Release Notes (link)
1
2
* Spring Cloud Sleuth
  This project has been removed from the release train. The core of this project has moved to Micrometer Tracing project and the instrumentations will be moved to Micrometer and all respective projects (no longer all instrumentations will be done in a single repository.
Micrometer Tracing
Micrometer Tracing은 Micrometer의 ObservationAPI를 확장하여 분산 추적을 지원하는 프로젝트이다. Spring Cloud Sleuth 를 사용하지 않고 Micrometer Tracing 을 사용하려면 아래의 의존성을 추가하면 된다.
dependency
1
2
3
4
implementation 'io.micrometer:micrometer-tracing-bridge-brave'
implementation 'io.zipkin.reporter2:zipkin-reporter-brave'
implementation 'io.micrometer:micrometer-observation'
implementation 'org.springframework.boot:spring-boot-starter-actuator' // 필수
로그 패턴 임의 설정
Micrometer Tracing + Spring Boot 3.0.x 에서는 로그 패턴을 직접 설정해줘야 한다. 형식은 취향에 맞게 정하자.
1
logging.pattern.level: "%5p [${spring.application.name:},trace-id : %X{traceId:-}, span-id : %X{spanId:-}]"
Prometheus 설정
Prometheus는 오픈 소스 기반의 모니터링 시스템이다. 수집하려는 대상의 Metric을 수집하여 그라파나를 통해 시각화를 지원한다.
dependency
1
2
3
4
5
6
7
8
// Actuator
implementation 'org.springframework.boot:spring-boot-starter-actuator'

// Micrometer to Prometheus
implementation 'io.micrometer:micrometer-registry-prometheus'

// Aop
implementation 'org.springframework.boot:spring-boot-starter-aop'
Actuator가 필요한 필요는 필요한 Metric을 Actuator가 제공해주기 때문이다. 그러면 yaml을 다음과 같이 설정해야 하는데.
application.yml
1
2
3
4
5
6
7
8
management:
  endpoints:
    web:
      exposure:
        include: health, info, metrics, info, prometheus, httptrace
  tracing:
    sampling:
      probability: 1.0
마지막에 mamagement.tracing.sampling.probability 는 추적 데이터가 얼마나 많이 수집 되는지를 결정하는 비율이다. 범위는 0.0 ~ 1.0까지로 1은 모든 요청을 추적한다는 설정이다.
1로 설정할 경우, 성능이나 저장 공간에 영향을 줄 수 있으니 적절한 값으로 설정해야 한다. 테스트 환경이니 1로 설정했다.
Controller
1
2
3
4
5
@GetMapping("/{userId}")
@Timed(value = "members.search", longTask = true)
public ResponseEntity<MemberInfoDto> getMember(@PathVariable String userId) {
	return ResponseEntity.ok(memberQueryService.findMemberByUserId(userId));
}
단순히 맴버를 조회하는 API이다. 여기서 @Timed 에너테이션을 통해 intercepting types 이나 methods을 측정할 수 있게 된다.
이 측정된 값은 actuator의 metrics를 통해 확인이 가능하다. @Timed 설정을 하고 metrics를 확인해보면 value로 설정된 값이 확인되지 않는다. 하지만 요청이 한 번이라도 이루어지면 바로 확인이 가능하다.
value는 매트릭스 이름이다. longTask는 장시간 실행되는 작업을 측정할지 여부를 지정한다.
Config
1
2
3
4
5
6
7
8
9
@Configuration(proxyBeanMethods = false)
@EnableAspectJAutoProxy
public class MeticsConfig {

	@Bean
	public TimedAspect timedAspect(MeterRegistry registry) {
		return new TimedAspect(registry);
	}
}
왜 의존성에 AOP를 추가했는지가 여기서 나온다.
TimedAspect를 빈으로 설정하면 @Timed 애너테이션이 달린 메서드를 찾아서 Proxy로 감싸준다. TimeAspect을 빈으로 생성하지 않으면 @Timed 애너테이션을 읽을 수 없다.
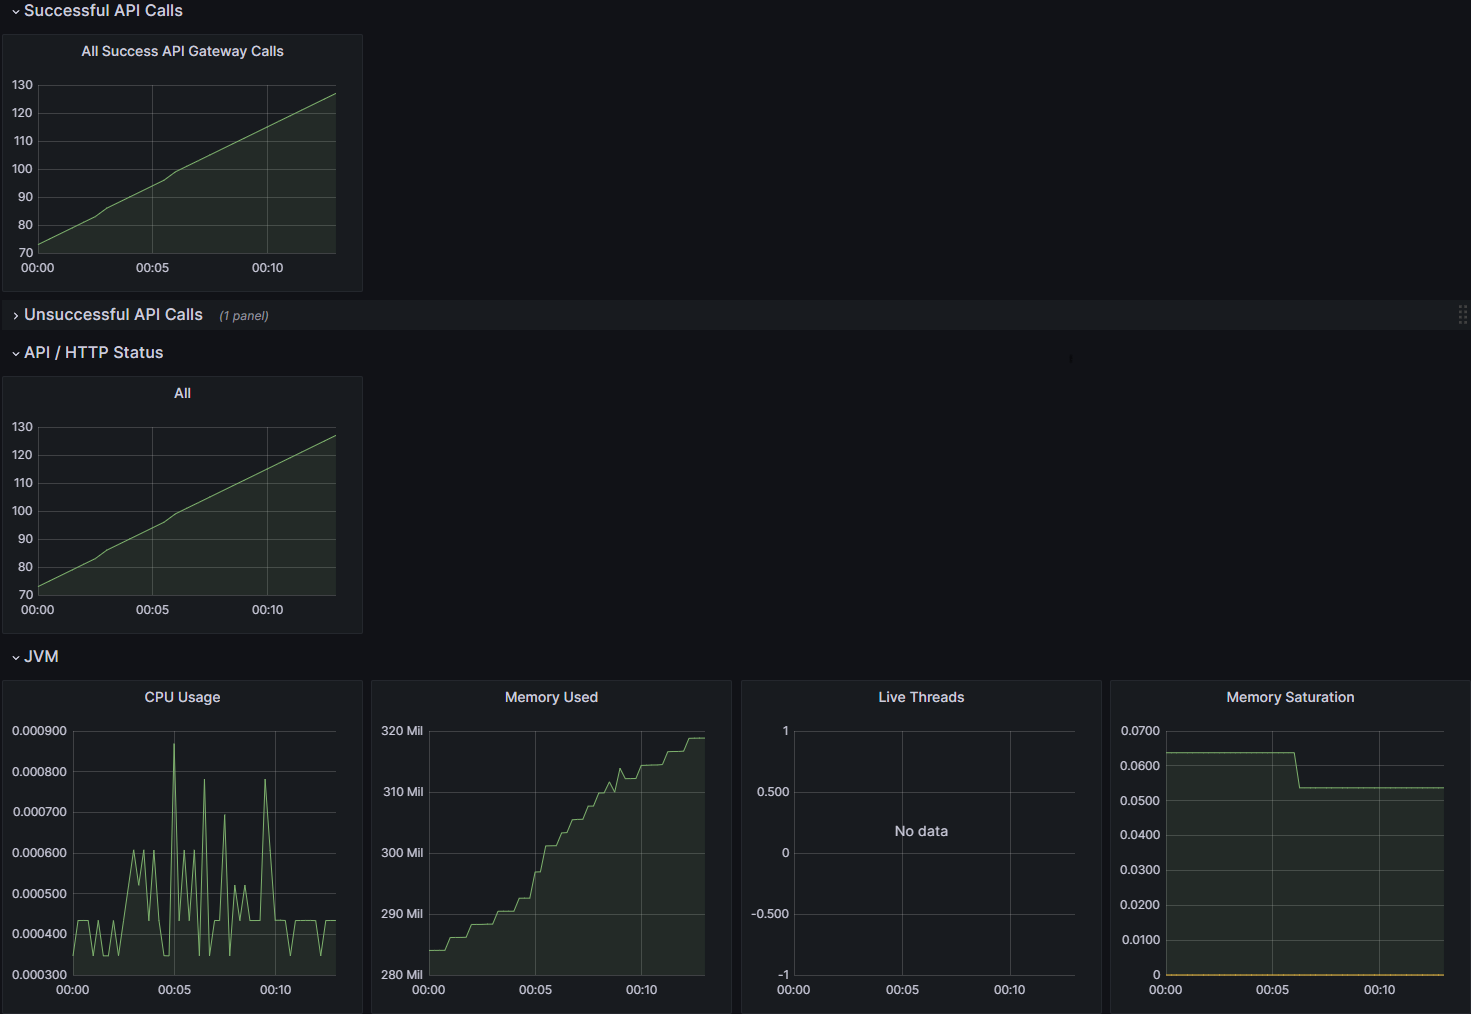
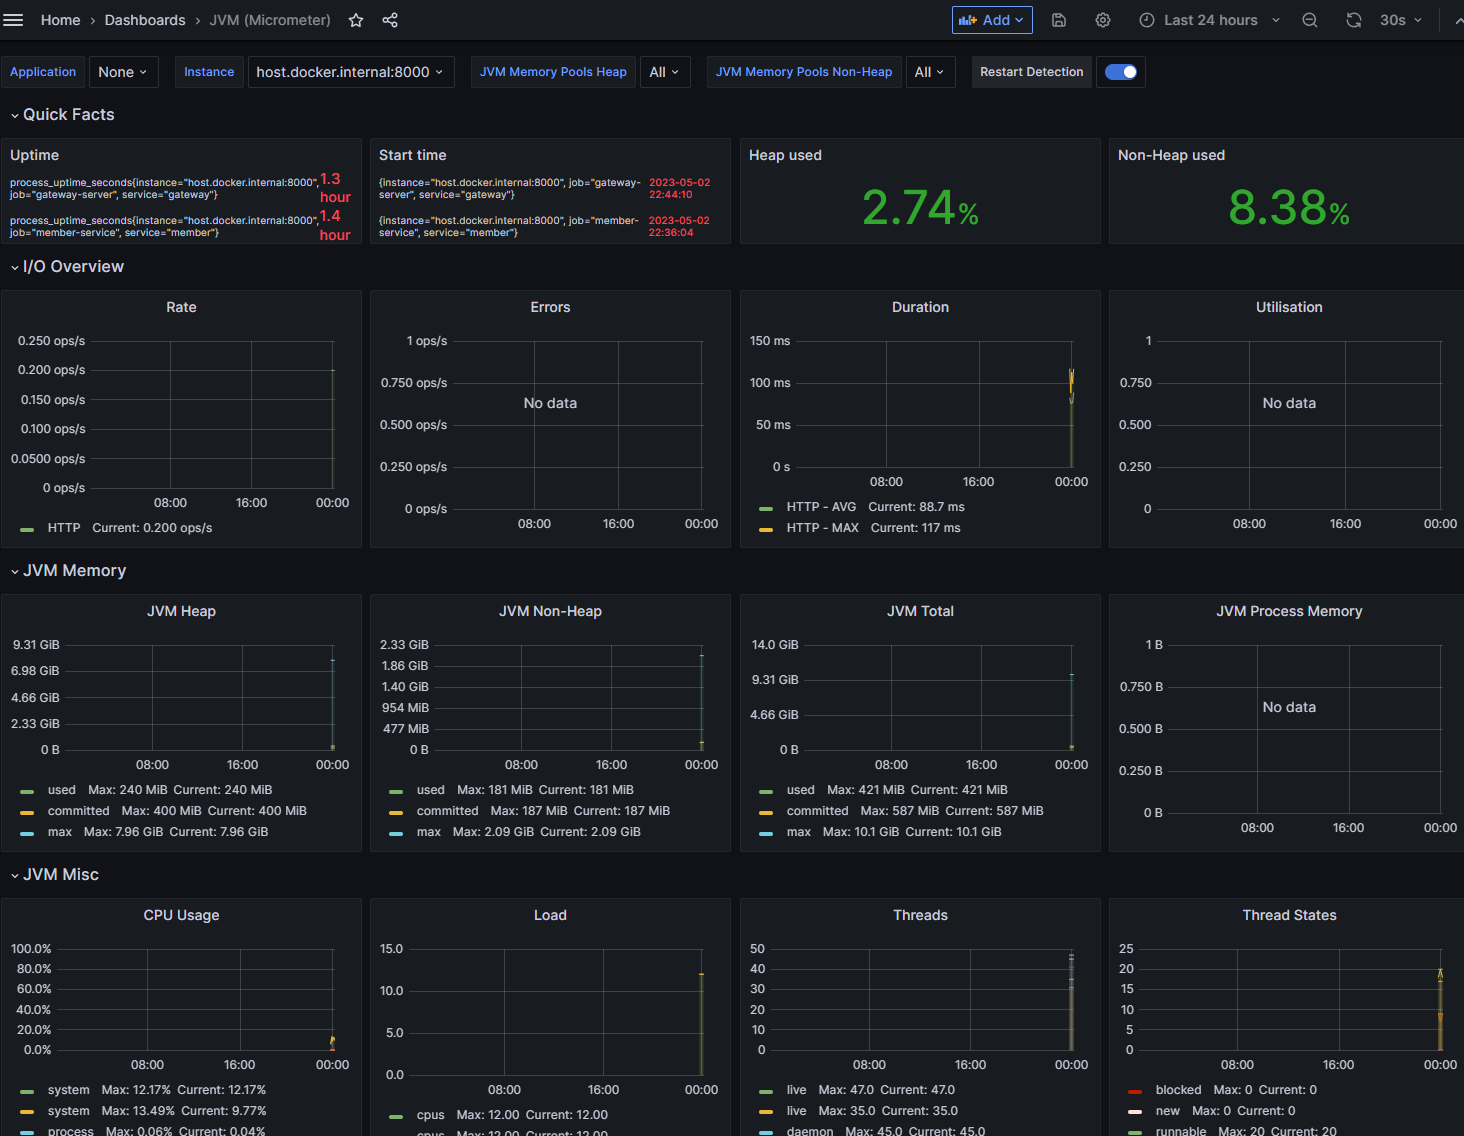
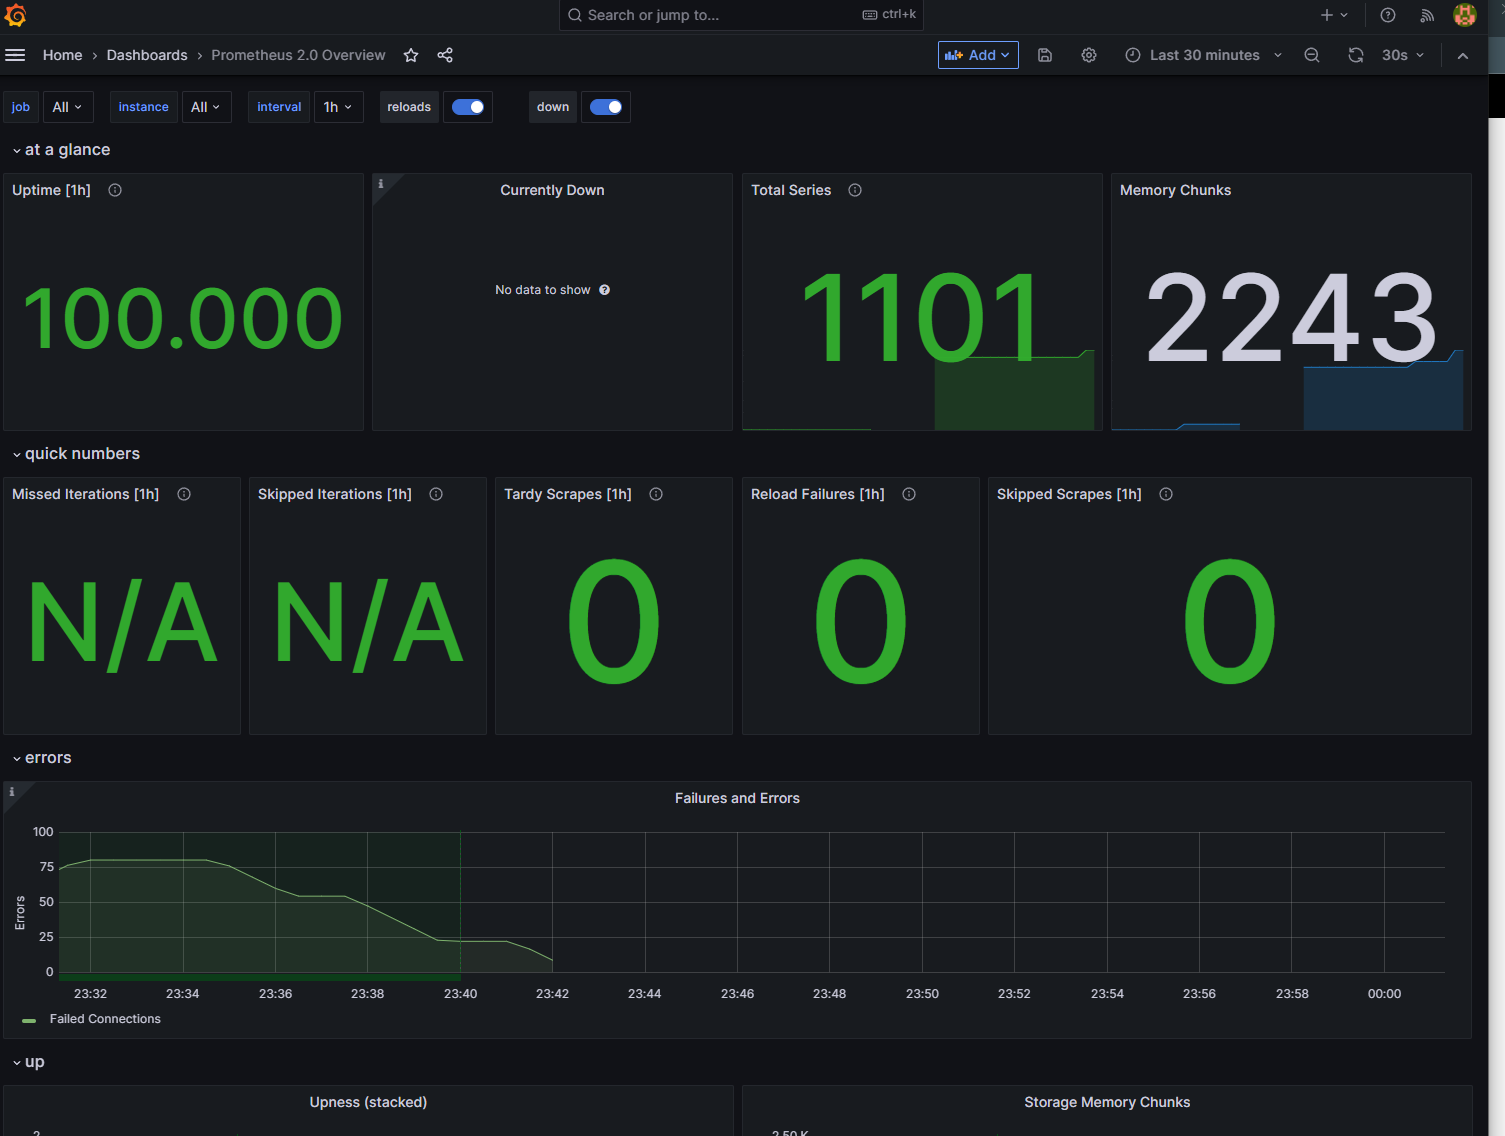
이제 그라파나를 이용하여 모니터링을 화면을 설정하면 아래와 같이 나오게 된다.
Gateway
JVM
Prometheus
참고
actuator prometheus grafana set-up